Enriched Ag provides users with new Soil Health Dashboard to easily understand farm or ranch data.
“Essentially, all life depends upon the soil … There can be no life without soil and no soil without life; they have evolved together.” – Charles E. Kellogg
In the day-to-day hustle and bustle, particularly on the farm or ranch, it’s sometimes easy to forget about your essentials unless a problem arises. Soil, water and sunlight are all crucial elements of agricultural production.
Of course, Mother Nature has her own plans that can at times differ from our own. We plan. We revise the plan. We adapt. We monitor. We work with Mother Nature to help protect the land while making it more productive.
A focus on soil
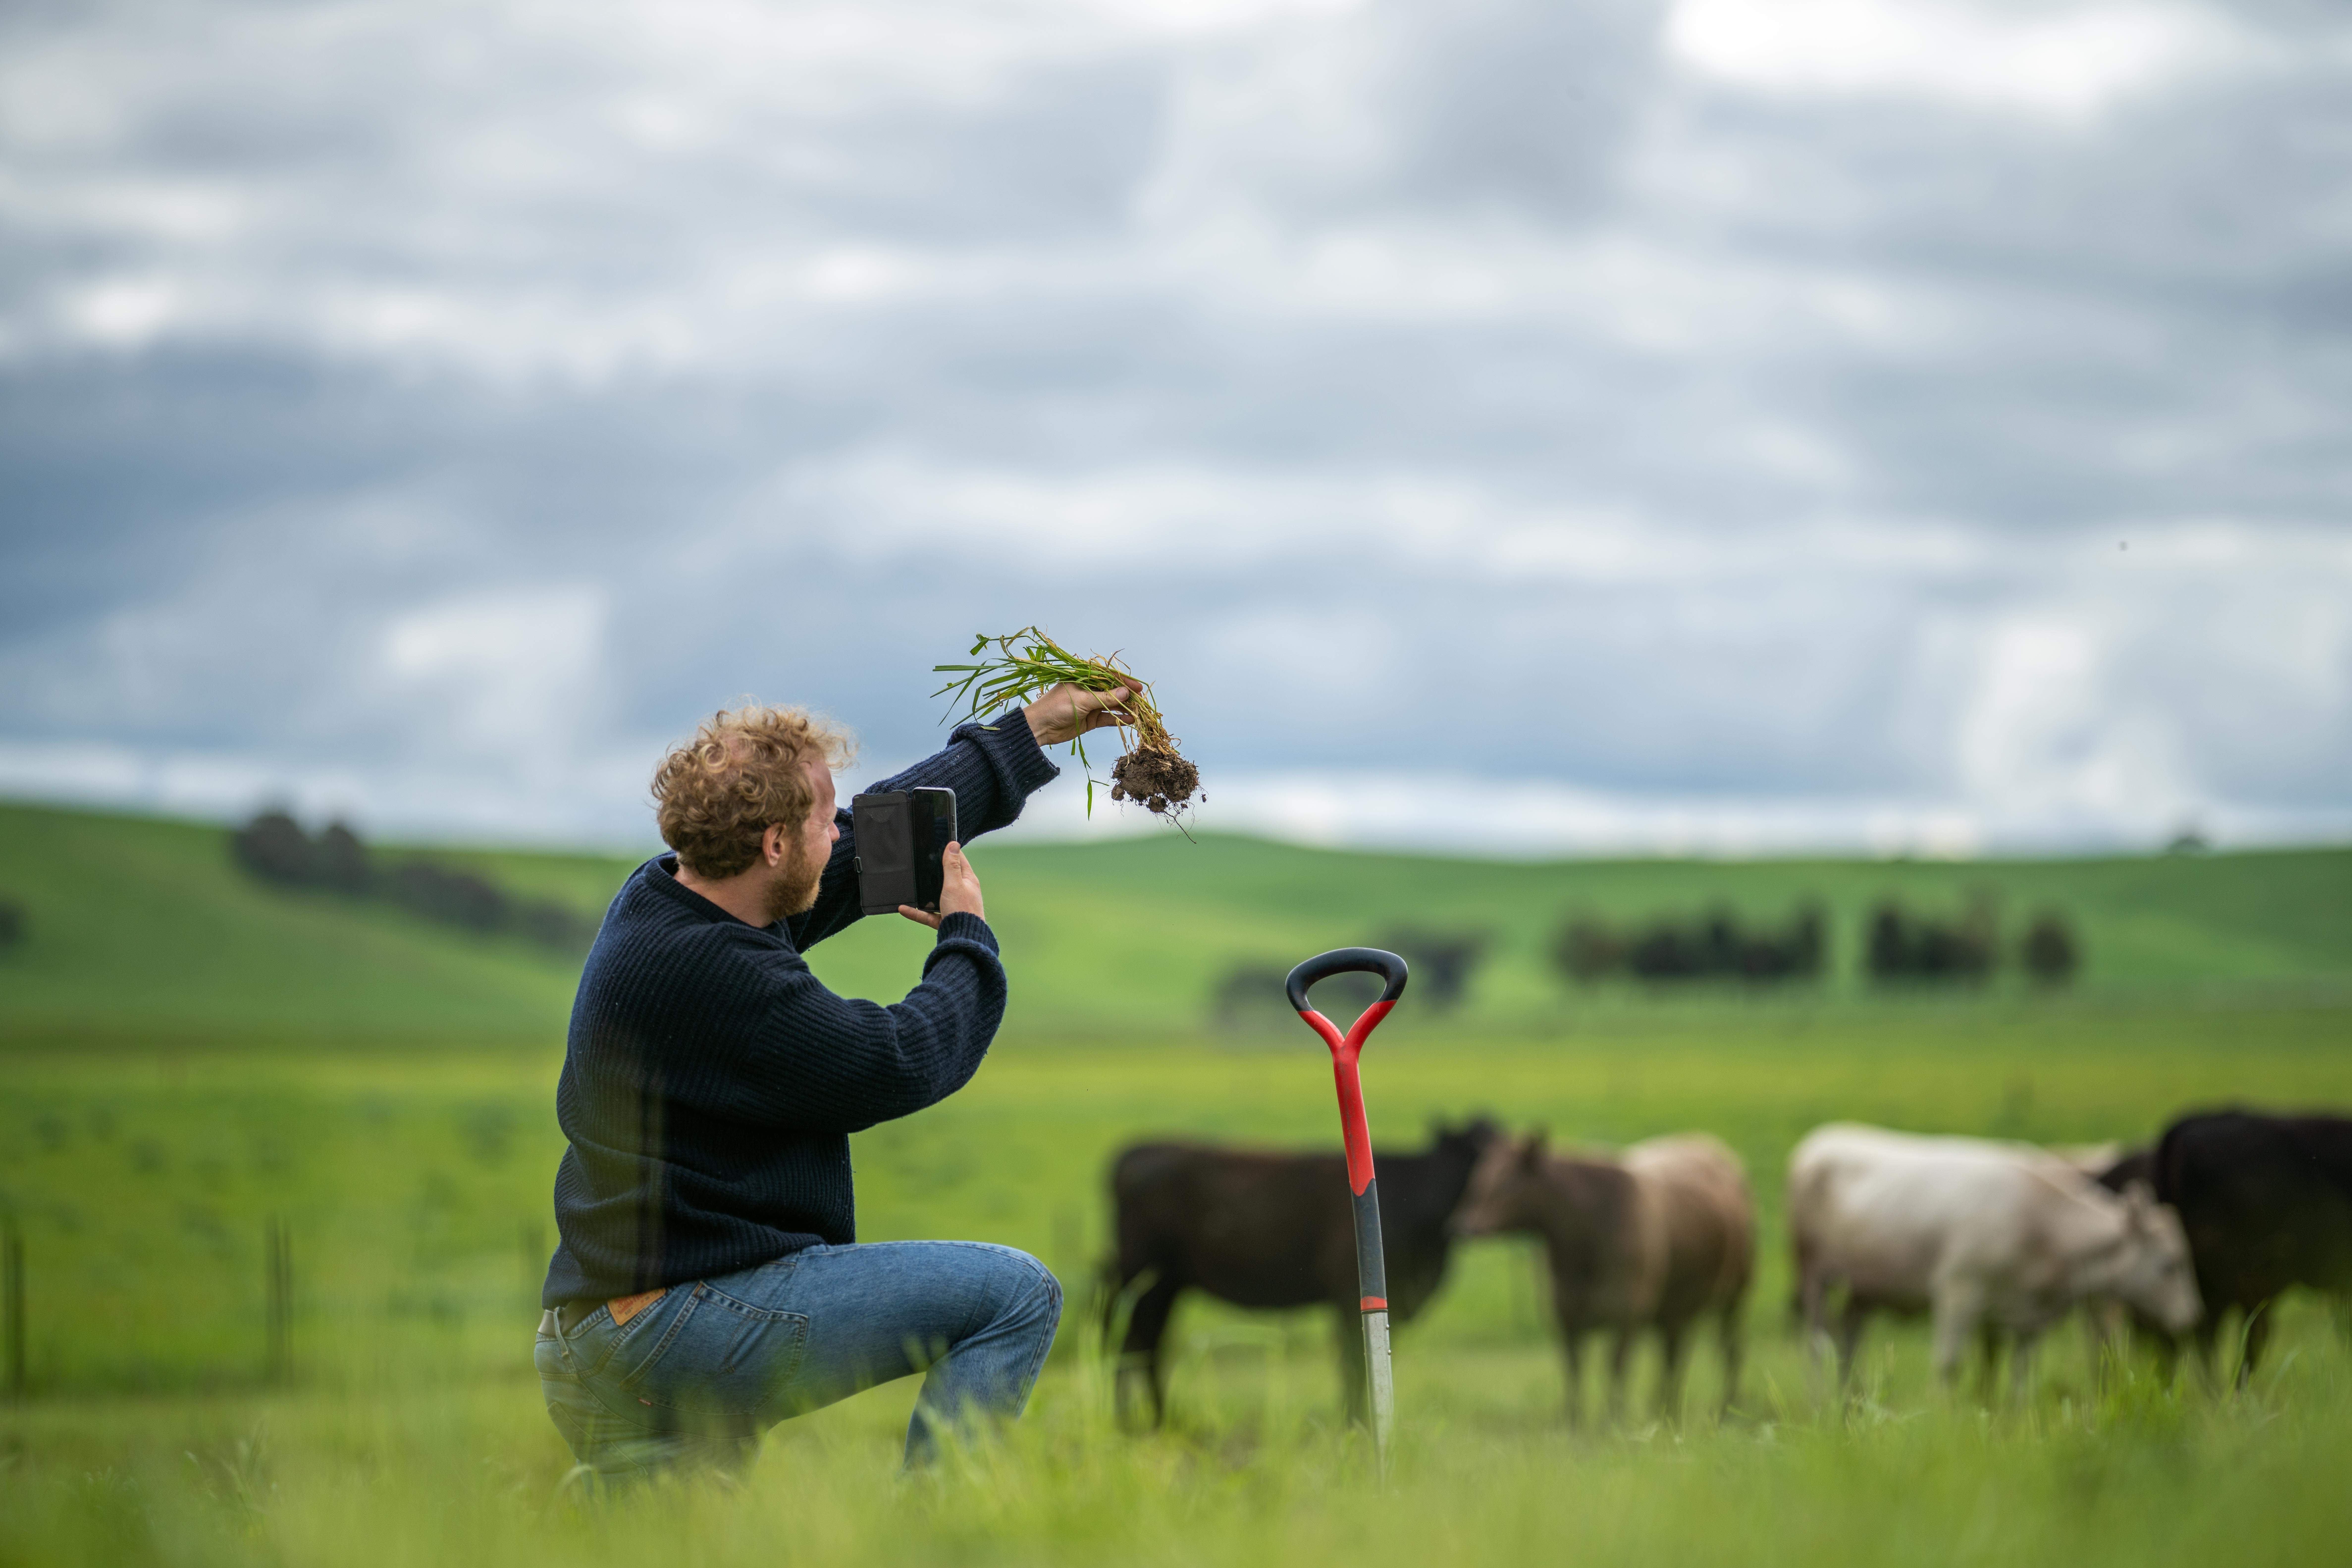
At Enriched Ag, we believe the actions you take above the ground influence what goes on in the soil below ground. Improvements in soil health mean better plant health and animal health. This process is both cyclical and evolutionary. And, we can now help you paint this picture on your particular farm or ranch more clearly.
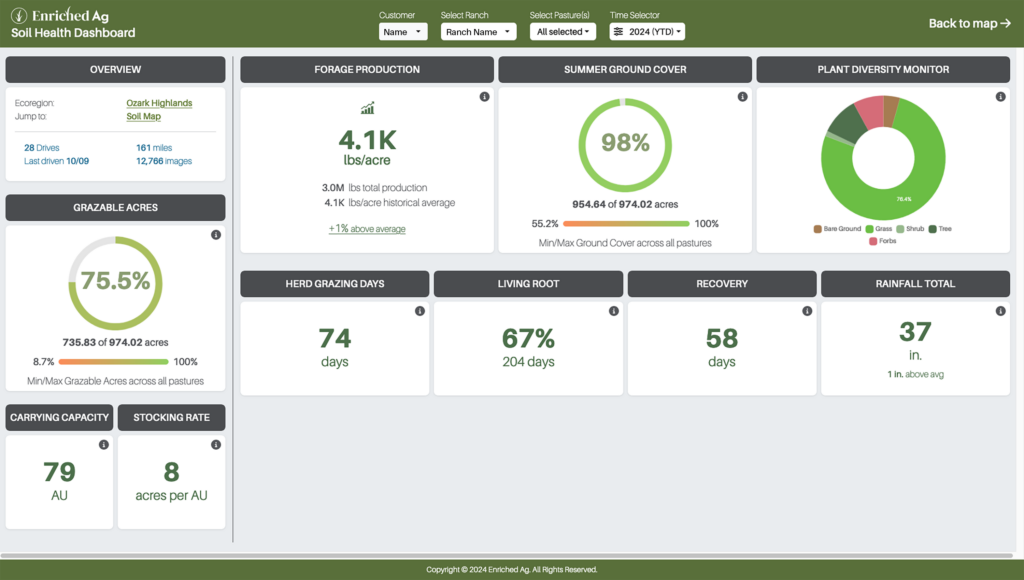
The Soil Health Dashboard, now available to Enriched Ag customers, is a graphical snapshot of your farm or ranch data. The dashboard includes data points generated from our Enriched Ag Insights and Enriched Ag Vision products, and everything you see goes back to one or more of the “Six Principles of Soil Health.” Those principles include:
- Know your context (Understand the unique characteristics of your land and operation)
- Keep soil covered (Monitor bare ground and disturbance, and promote vegetation recovery)
- Optimize disturbance (Manage stock density and implement effective recovery periods)
- Increase plant diversity (Identify and quantify plant groups to enhance pasture and livestock health)
- Keep living roots (Identify living plant functional groups and make decisions for year-round growth)
- Integrate livestock (Include livestock in land management practices for nutrient cycling)
Monitoring data related to these soil health principles allows you to better understand the impact of your management decisions. Not only can you view your entire farm or ranch metrics, but you can also select pastures and a particular year to review more concise data with this easy-to-use, dynamic tool.
Kenny Dhakal, Enriched Ag’s scientific engagement lead, says the Enriched Ag team built the Soil Health Dashboard by incorporating input and feedback from agricultural producers, advisors and other experts. The team presented them with questions, such as:
- What operational metrics do you really care about?
- What metrics are easiest to understand?
- What metrics can inform you to help improve your bottom line?
“Our tech team built the platform to be lightweight, scalable and incredibly fast,” Dhakal says. “Using industry-standard design principles, we’ve crafted a highly responsive dashboard that works seamlessly across any device—a cellphone, laptop or tablet.”
How soil health principles apply to the metrics we monitor
The Soil Health Dashboard gives our customers important information in a clean, easy-to-read format. The data points are broken into boxes and include, for example:
- Ecoregion, Grazable Acres, Forage Production and Rainfall Total, all of which are key to knowing the context of your land
- Summer Ground Cover, which is pertinent to keeping soil covered
- Recovery (presented in days), to fit the “optimize disturbance” principle
- Plant Diversity Monitor, to view your breakdown of plant functional groups and historical changes that can affect soil health
- Living Root Days (presented as a percentage), to aim for maximizing days of canopy stand on pastures
- Herd Grazing Days, Stocking Rate and Carrying Capacity, which show how livestock integration works hand-in-hand with soil health and to provide a better understanding of forage supply and demand
“Behind the scenes, these metrics are powered by more than 15 proprietary machine learning and computer vision models, which we continually improve,” Dhakal says. “We focus on delivering real value to users by framing the dashboard around actionable outcomes and insights tied to the data points.”
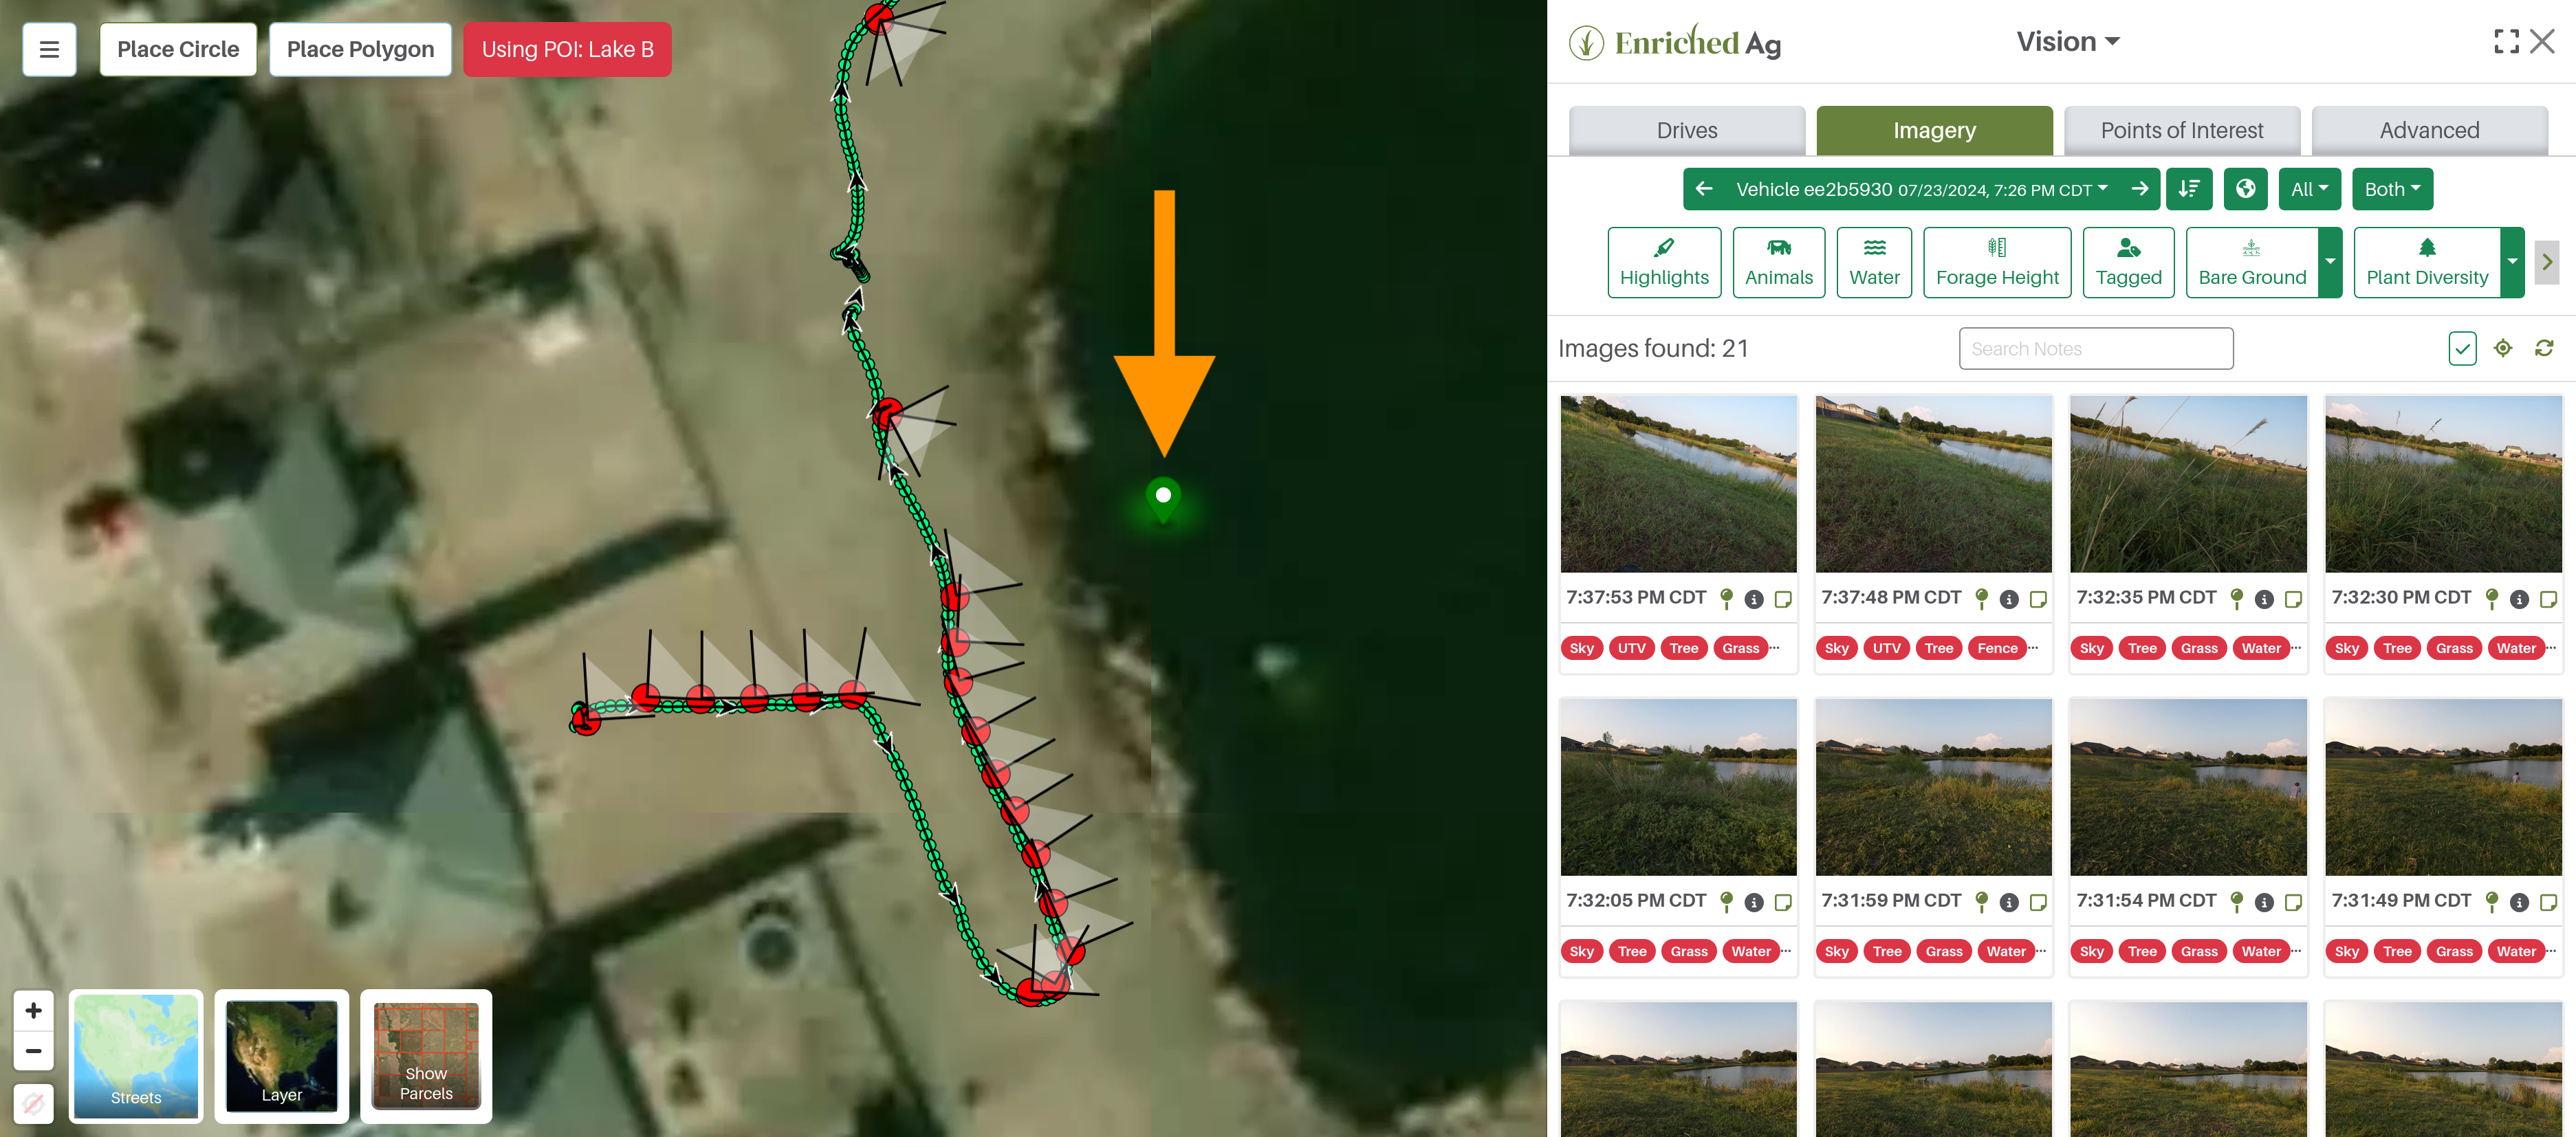
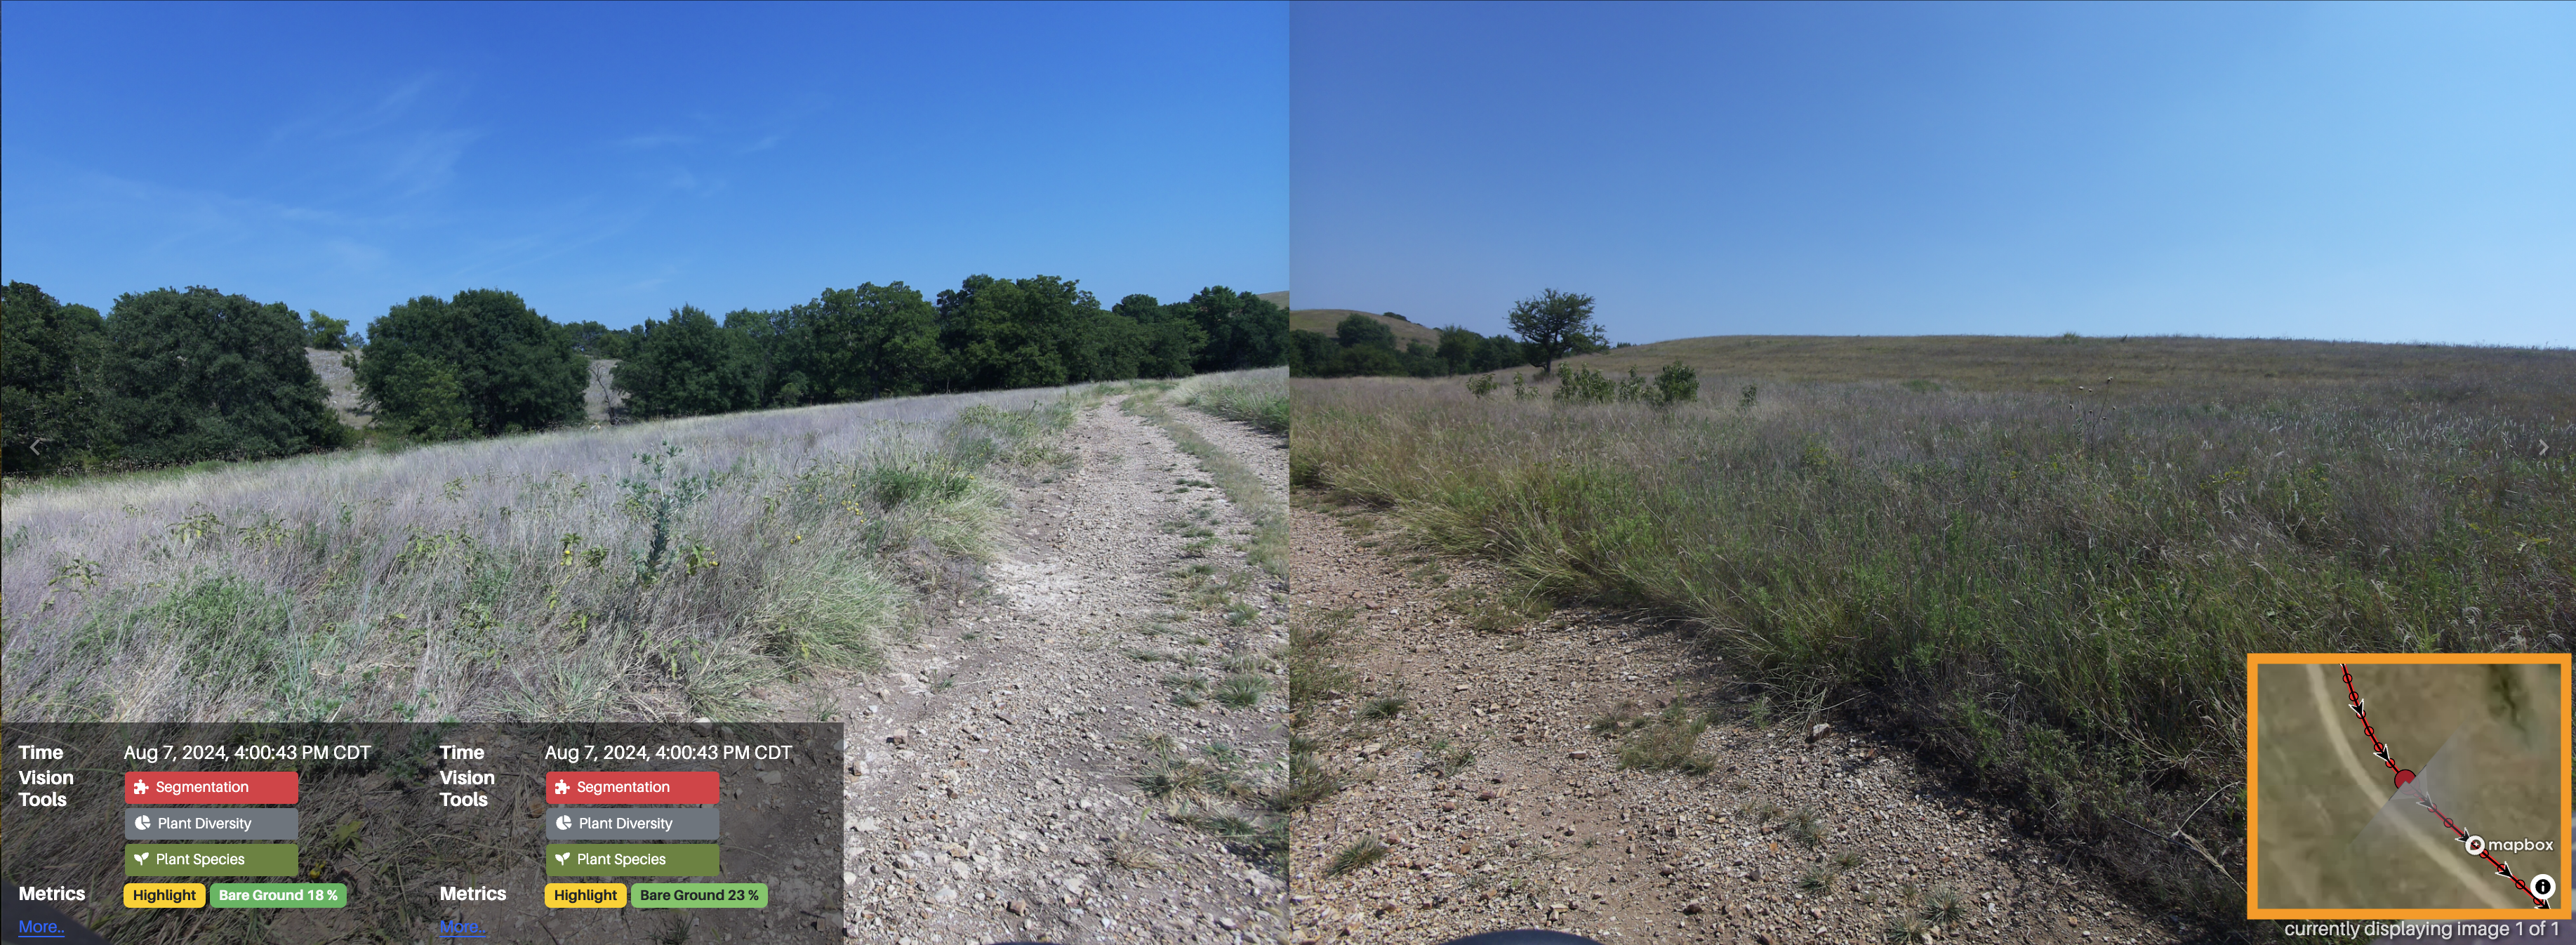
In addition, users can see their drive data, which includes the total number of drives, how many total miles driven and the number of total collected images captured with Enriched Ag Vision.
Dhakal says driving across your land frequently and collecting images with Enriched Ag Vision is key to capturing subtle and seasonal changes in natural ecosystems. These frequent drives help understand what’s happening on the ground to make informed management decisions for grazing and conservation.
“Grazing pressure, weather, plant growth and water resources are continuously changing in agricultural lands,” Dhakal says. “By driving more, we can monitor processes that might otherwise go unnoticed, such as the spread of invasive species, forage recovery or changes in bare ground.”
As you continually collect images from your drives, the data on your dashboard becomes more representative of the underlying variability of the land, he said. This means you can have greater confidence regarding the happenings on your land, and therefore, can better showcase your land stewardship efforts.
The dashboard meets marketing
Many reasons exist for producers to work toward improving the land. A primary reason may be to leave the land better for the next generation of farmers and ranchers. Another reason is likely to increase production efficiency and profitability. Yet another reason could be that data provided by the Soil Health Dashboard can substantiate your production marketing claims.
Words and phrases that center around “sustainability” and “regenerative agriculture” in the industry are popular, because many consumers want to support these practices. However, it hasn’t been easy to back such claims in a quantitative way — until now.
“We’re excited about how this low-cost, producer-centric technology can easily be customized to meet the needs of individual producers, government programs or corporate partners,” Dhakal says. “This approach breaks down barriers to adoption by making the dashboard practical and accessible.”
We at Enriched Ag look forward to continuing our work with producers and partners in research, education and industry, to be the easy-to-use monitoring at scale platform of choice for agriculture. Contact us at sales@enriched.ag to get started.
— The Enriched Ag Team
